Projects
In this section, I showcase a range of data analysis and visualization projects that highlight the application of Power BI in real-world scenarios. Each project represents a unique challenge and demonstrates the use of data to derive actionable insights. The section features interactive reports, detailed analyses, and visualizations created using Power BI, illustrating proficiency in transforming raw data into meaningful insights.
2022 T20 Cricket World Cup Analysis
This project involves analyzing the 2022 T20 Cricket World Cup using data extracted from ESPN Cricinfo. The data was scraped using Bright Data and processed with Python in Jupyter Notebook. The analysis focused on key performance metrics and parameters to evaluate team and player performances. The Power BI report created presents interactive dashboards and insights based on this comprehensive data analysis.
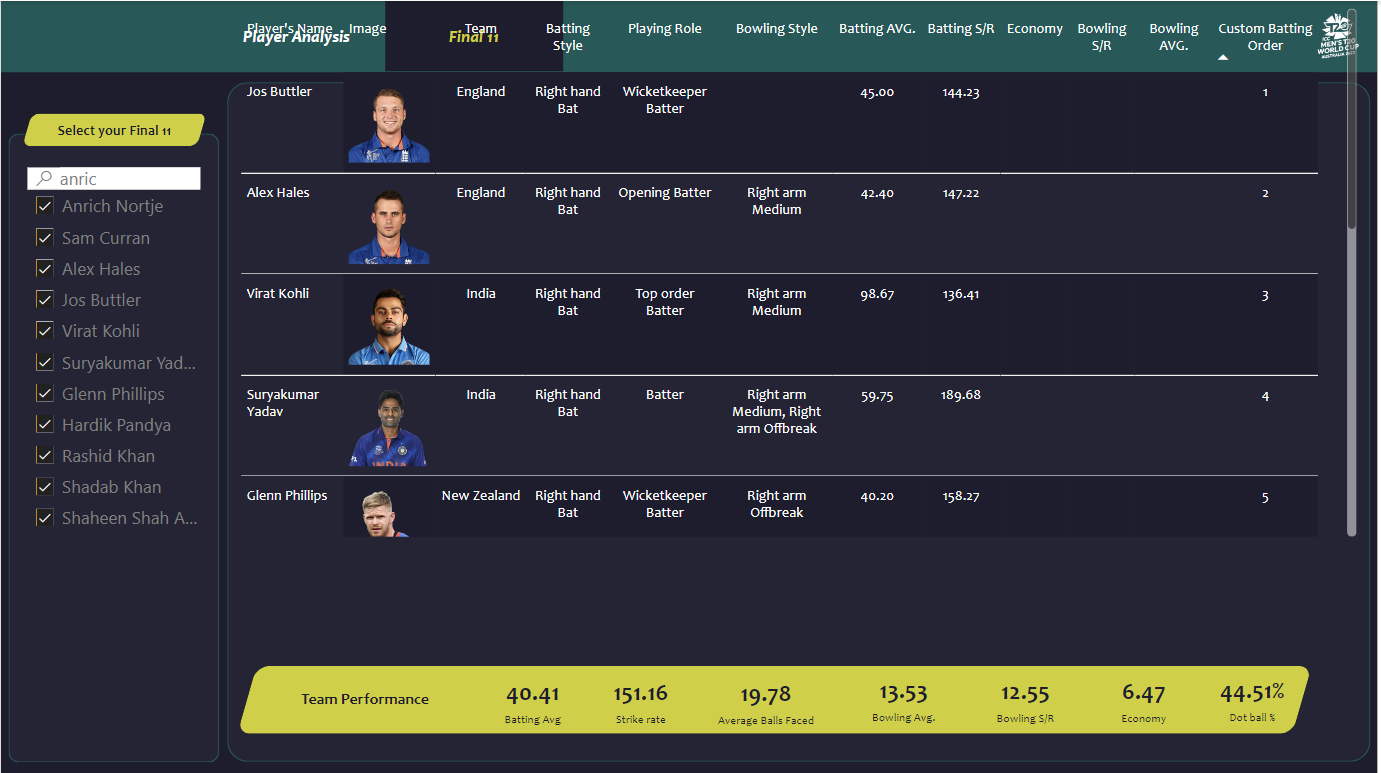
Team Performance
The team should be able to score at least 180 runs on average and defend 150 runs on average.
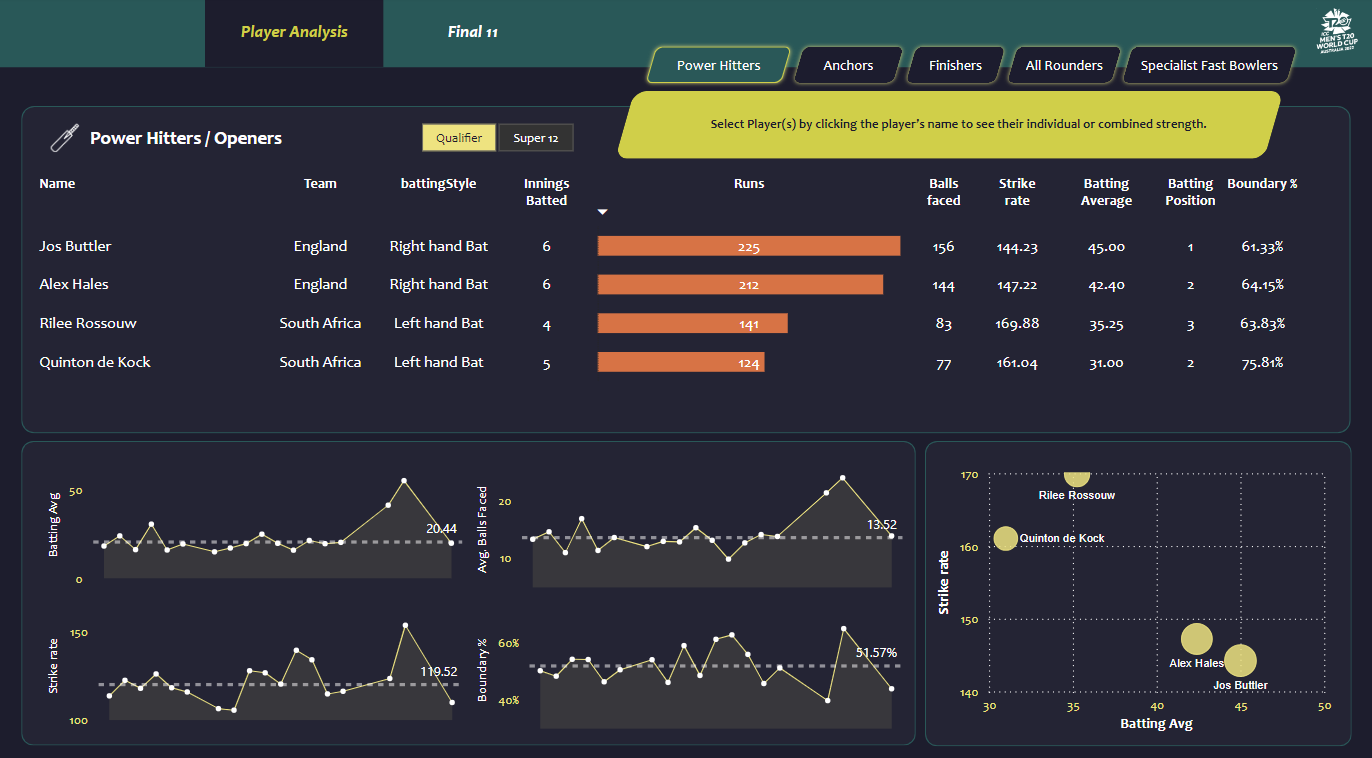
Openers
Parameters for openers include batting average > 30, strike rate > 140, innings batted > 3, boundary % > 50, and batting position < 4.
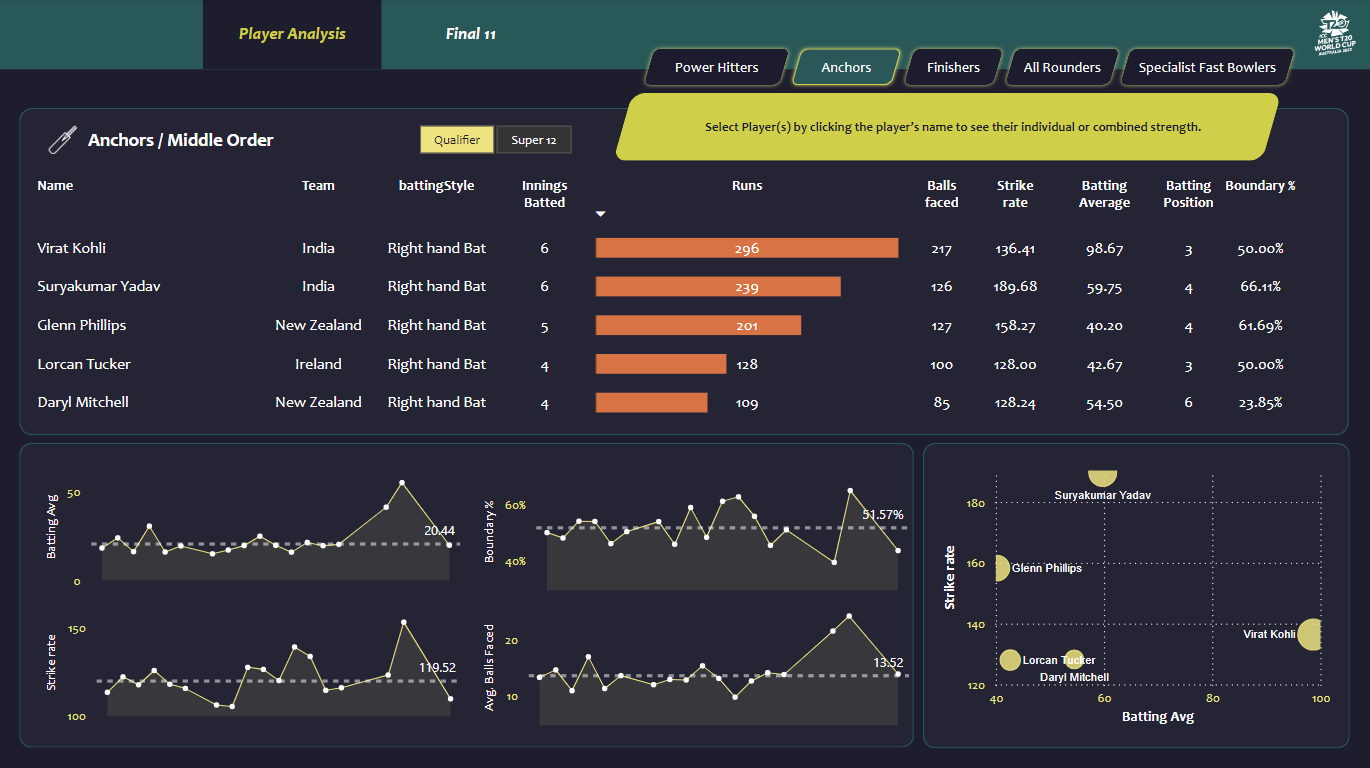
Middle Order
Parameters for middle order include batting average > 40, strike rate > 125, innings batted > 3, average balls faced > 20, and batting position > 2.
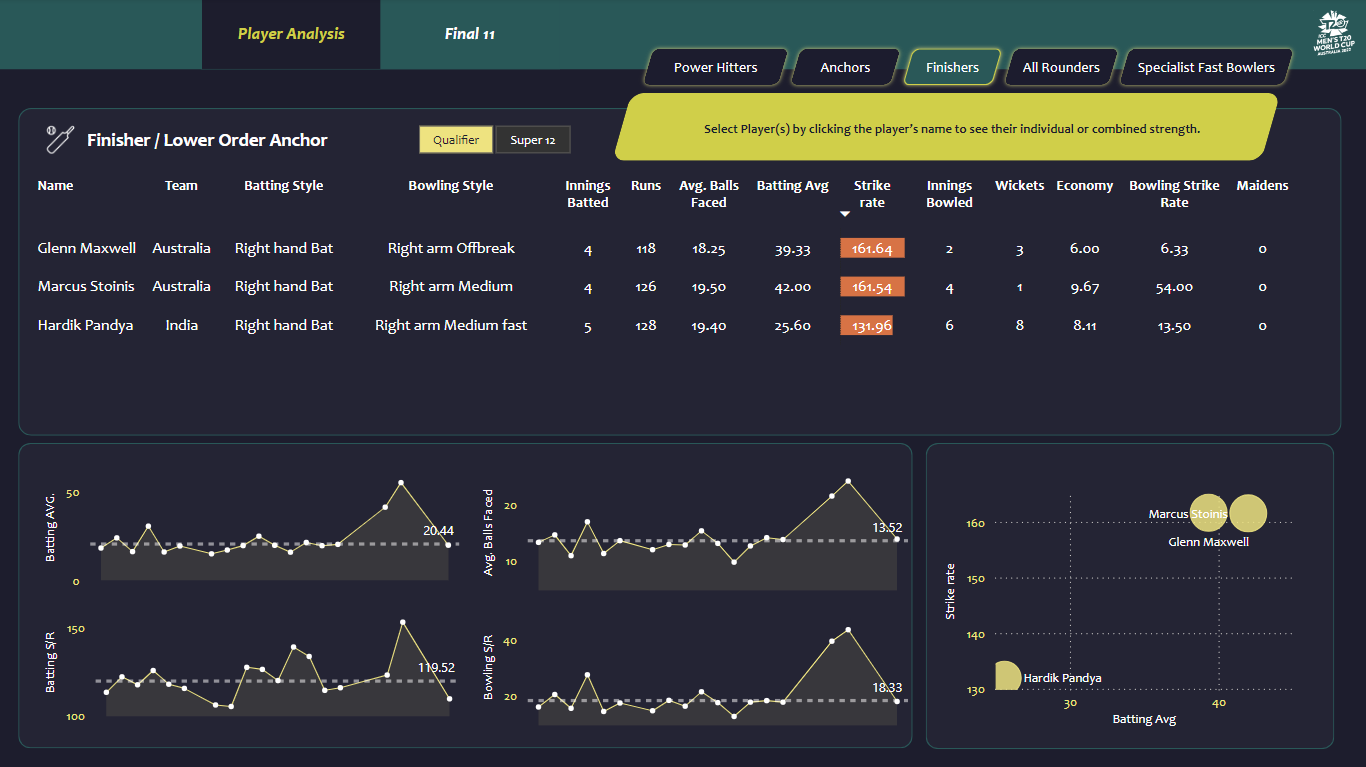
Finisher
Parameters for finishers include batting average > 25, strike rate > 130, innings batted > 3, average balls faced > 12, batting position < 4, and innings bowled > 1.
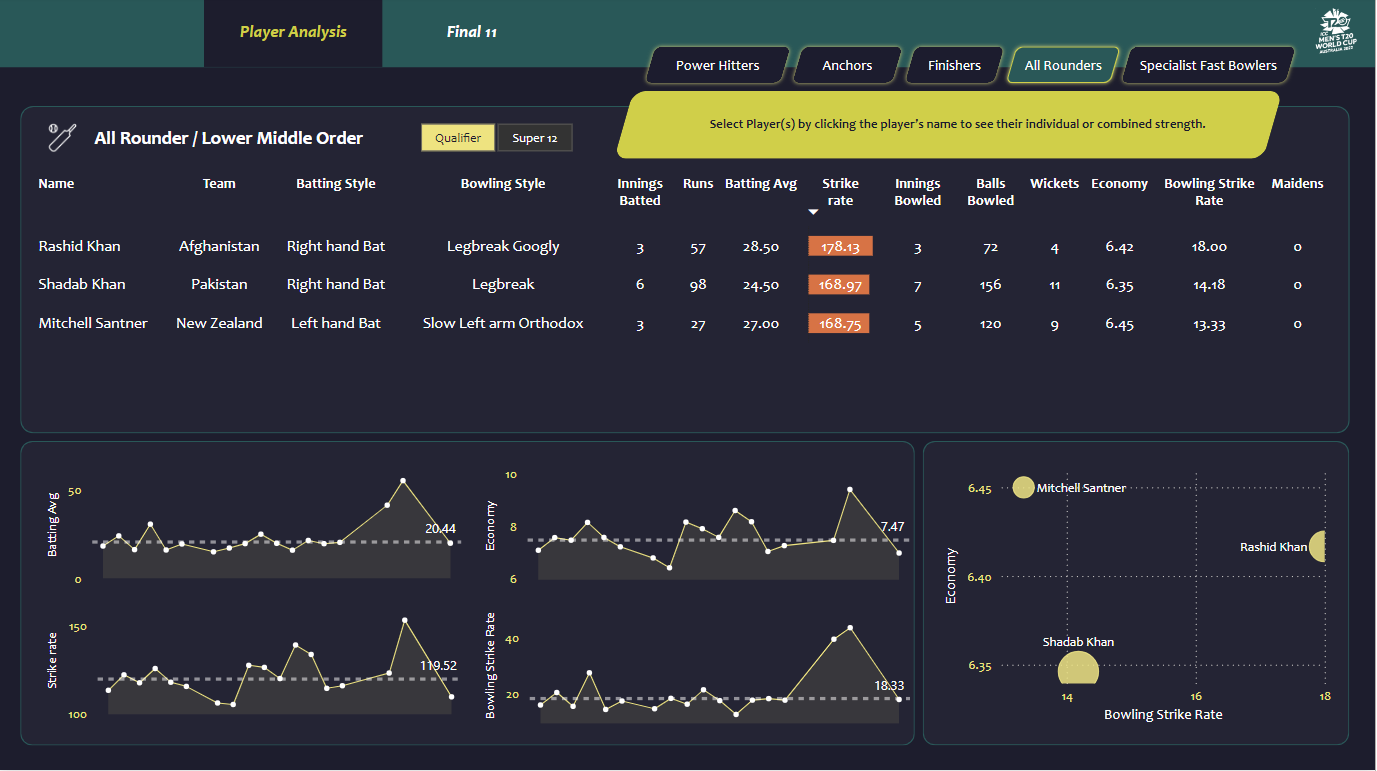
All-Rounders
Parameters for all-rounders include batting average > 15, strike rate > 140, innings batted > 2, batting position > 4, innings bowled > 2, bowling economy < 7, and bowling strike rate < 20.
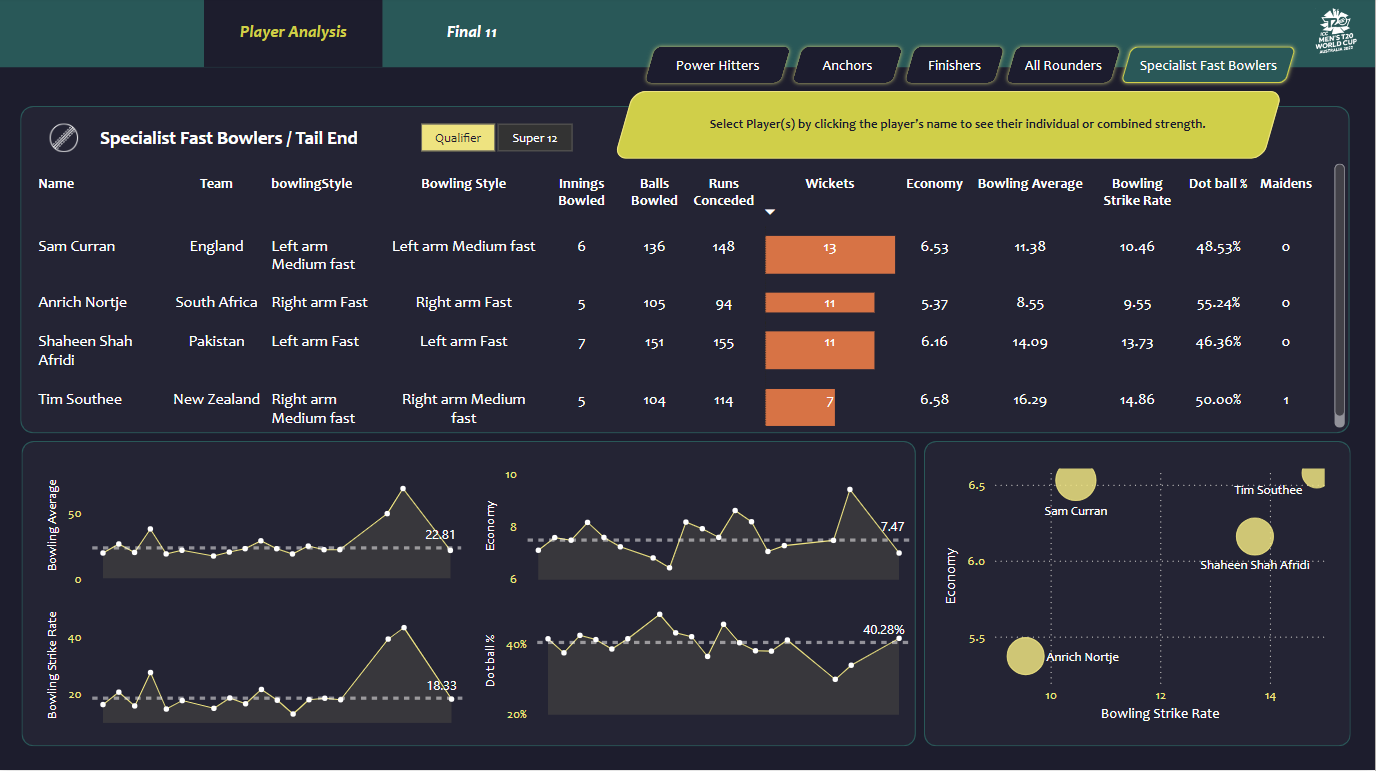
Fast Bowlers
Parameters for fast bowlers include innings bowled > 4, bowling economy < 7, bowling strike rate < 16, bowling average < 20, and dot ball % > 40.
Interactive Power BI Report
Sign in to Microsoft Power BI to interact with the report.